Predict a Magic Card’s Color Identity Based on Artwork
Problem
Can we predict the color identity of a Magic card by analyzing the colors represented in the artwork?

Collecting Data
Merging MTGJSON, Scryfall Data – Jupyter Notebook – Python
For this analysis, we used two datasets:
- Set data from MTGJSON.com
- Artwork data (links to card art of varying resolutions) using the Scryfall API
Before joining the datasets for our analysis, we had to first pull some nested data into their own columns. The Scryfall ID is the column we plan on using to join the tables, and the Cropped Art links are links to the image files we plan on analyzing.

Lastly, we filtered the set for Alpha edition cards exclusively, and subset the data to remove unnecessary columns.

Building a Solution
Analyzing MTG Art – Most Prominent Colors, Part 1 – Jupyter Notebook – Python
Analyzing MTG Art – Most Prominent Colors, Part 2 – Jupyter Notebook – Python
The way I want to analyze the color distribution is by taking each picture in a card’s artwork and classify it as a color, then returning a list of the colors that are featured the most along with the proportion at which they are featured.
To make help with classification of colors, we will first convert each image to a ‘numpy‘ array, with each element holding the RGB representation of a single pixel.

With the image in numerical form, we can perform a K Means clustering analysis with n = 5 clusters to group each of image’s pixels into one of five groups. The center RGB value of these five clusters will represent the five most prominent colors in the artwork we are analyzing. We can also compare the size of each cluster to calculate the proportion of pixels belong to each cluster.

The output of our clustering analysis is converted into a dataframe and we concatenate the new color and color proportion value features to our original dataset.

The last step is to turn each unique color into it’s own feature/column in the dataset. Then we want zero out the values for artworks where that feature is not prominent.

Data Visualizations Built with Dataset
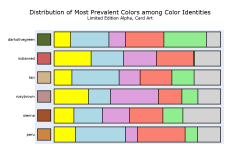
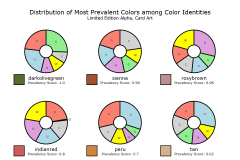
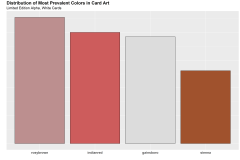
Analyzing MTG Art – Distribution of Colors – Jupyter Notebook – R
Color Distribution in MTG Art – Plotly – Jupyter Notebook – Python


