Utilizing Expected Runs Added to Evaluate Player Production, Efficiency
Problem
Expected Points Added (EPA) is a common statistic in the NFL analytics community used to evaluate production and efficiency. The statistic relies on game situation and context variables (i.e. down, distance, yards to goal) to predict the expected points scored on a given drive. Similarly, we can use context variables like outs and baserunners to predict expected runs scored in a given inning. Can we use Expected Runs Added to effectively measure individual player production and efficiency?
Collecting Data
Updated Script to Pull Season-Long MLB Data – Jupyter Notebook – R
BaseballR is a great package that can be used to pull all kinds of data including the play-by-play data used for this project. We pulled and merged two datasets: Statcast pitch data (which includes the Expected Run statistic), and season-long pitch-by-pitch data (which includes more context data) from the MLB Stats API.

Building a Solution
MLB Season-Long Summary, Hitters – Jupyter Notebook – Python
The merged dataset from the previous step was filtered and transformed into three separate tables for three different levels of granularity:
- Per Plate Appearance
- Per Game
- Season-Long

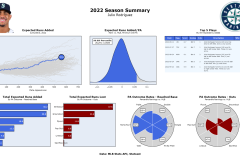
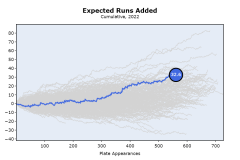
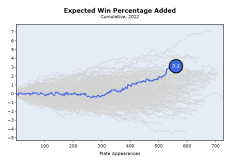
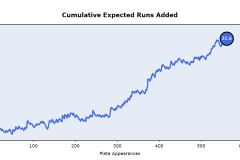
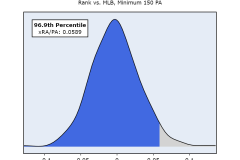
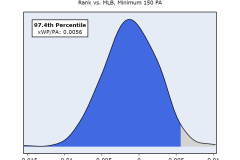
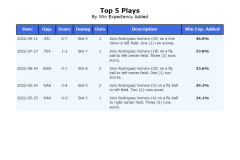
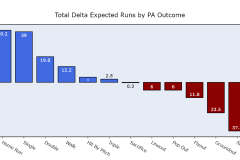
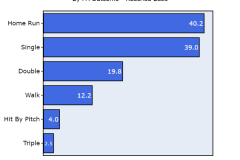
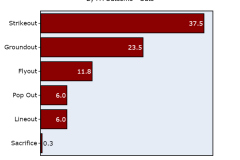
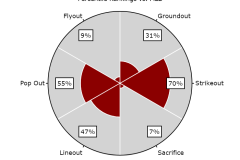
These tables were used as data sources to create visualizations (Python: Plotly) for cumulative statistics to show raw production, and per-plate-appearance statistics to show player efficiency versus the rest of the league. These visualizations were then combined (Python: Pillow, Plotly) to create a single graphic showing season-long production and efficiency for an individual player.

