Logan Gilbert, Late Season Adjustments, 2021
Problem
Logan Gilbert struggled for the first four months of his major league career (5-5, 5.44 ERA over 18 starts) but things started to click for him over the last month (1-0, 2.70 ERA over 6 starts). What changes or adjustments did Logan make down the stretch?
Collecting Data
BaseballR Examples – Jupyter Notebook – R
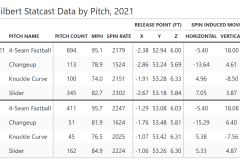
We used play-by-play data from ‘baseballR’ and combined that dataset with data from Statcast to allow us to look at spin rate. The first step was to create a unique ‘pitch_id‘ column and then join the two datasets on that column.

Building a Solution
With our dataset ready to go, my first thought was to look at release points. My assumption was that the release points of younger pitchers would have a higher variance as they tinker with their mechanics and figure out what works best for them.

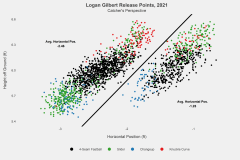
I expected to see some variation obviously, but here we can see two completely distinct groups! What’s causing this horizontal shift? We can see from the 2-dimensional (horizontal vs height) plot below that pitch type is not the cause.

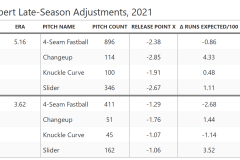
Some investigation will show us that the horizontal change in Logan’s release point was an adjustment made after his August 21st start against Houston in which he allowed 9 runs.
The shot below showing stills from an early and late-season game shows Logan shifted the starting point for his windup and confirm what we are seeing in the data.


Data Visualizations Using Dataset
Logan Gilbert, Release Point Plots, 2021 – Jupyter Notebook, R
Logan Gilbert, Late Season Adjustments, 2021 – Jupyter Notebook, R
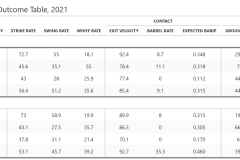
Logan Gilbert, Pitch Outcome Table, 2021 – Jupyter Notebook, R
Logan Gilbert, Statcast Data by Pitch, 2021 – Jupyter Notebook, R
Logan Gilbert, 2021 Release Points – Interactive (Plotly Dash) – Jupyter Notebook, Python


